Technology built for every stage of a carbon project.
From ideation to issuance, one connected system simplifies and automates every step of your carbon project. Develop projects faster, strengthen project integrity, and streamline delivery.

A mahogany tree takes 2.5 tonnes of CO₂e out of the air over 40 years. Proving it is the hard part.
- 03 · QuantifyFloraCarbon
- 01 · CollectFloraTrace
- 02 · AssessFloraScope
The field app
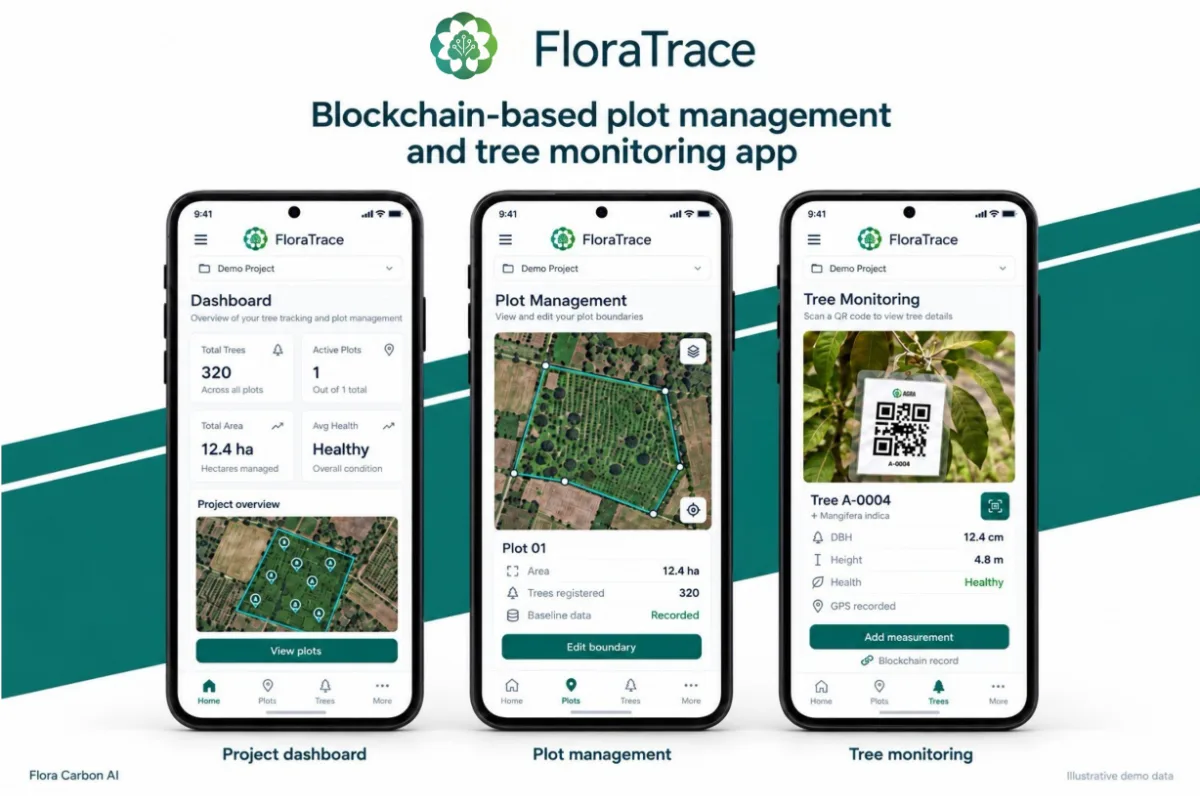
Start in the field with FloraTrace.
- Map plot boundaries and run the baseline survey in the field.
- QR-tag every tree with species, location, DBH, height, health and a photograph.
- Records sync to the Flora portal, so field data starts every later step.

One operating system for every stage of your carbon project.
From mapping your plot boundary and collecting baseline farm data to filing the final report with the registry, each module handles one stage and passes a structured record to the next. Nothing is re-entered, and one audit trail runs from field to registry.
01 / 05
Collect · FloraTrace
Capture the ground data
A field app for project teams. Map plot boundaries, run the baseline survey, and QR-tag every tree with its species, location, DBH, height, health and a photograph. Records sync to the Flora portal, so the field data is the starting point for every later step.
- Starts from
- Plots, farms and saplings
- Hands on
- Plot boundaries (KML), baseline data and per-tree records, synced to the portal
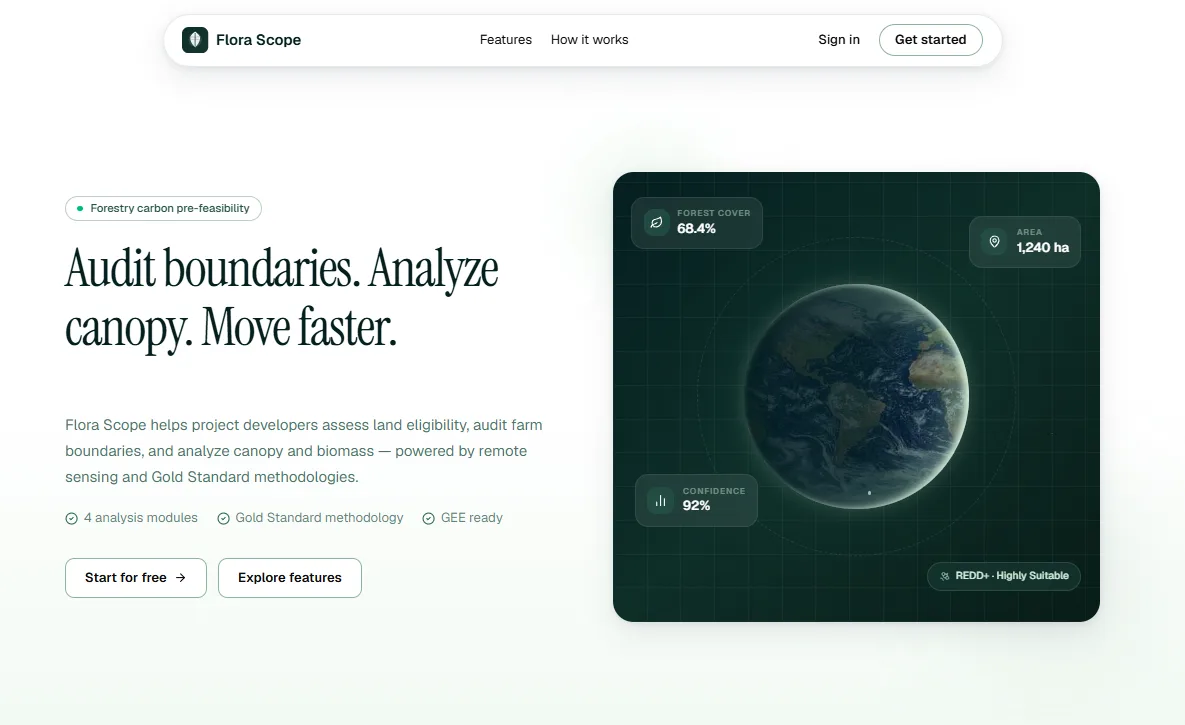 Satellite historyLand use, forest loss, terrain and climate, read for the boundary.The boundaryThe parcel every later stage is measured against.EligibilityScored against Gold Standard eligibility before anyone visits the site.
02 / 05
Assess · FloraScope
Assess and monitor from space
Takes the boundaries and baseline from FloraTrace and runs satellite pre-feasibility: land-use history, forest loss, terrain and climate, scored against Carbon Standard eligibility before anyone visits the site. After planting, it monitors canopy and vegetation remotely and checks them against tree records verified in the field (monitoring: coming soon).
- Starts from
- A boundary (KML) and baseline data
- Hands on
- Land-use and forest-loss history, an eligibility score, and satellite monitoring cross-checked against field data (monitoring: coming soon)
 Growth modelsSpecies-level sequestration for seventy-five-plus species across six countries.Year by yeartCO₂e for each year of a thirty-year horizon, with the model behind every figure.
03 / 05
Quantify · FloraCarbon
Know your credits and revenue
Species-level sequestration over a thirty-year horizon, using growth models for more than seventy-five species across six countries, calibrated on eight registered projects. Baseline, leakage and buffer are deducted to give net credits by year; estimated project revenue is coming soon.
- Starts from
- Species mix, planting density and horizon
- Hands on
- Net tCO₂e by year, with the growth model behind every figure (revenue estimates coming soon)
 A drafted PDDThe Project Design Document, with a citation behind each claim.Compliance gapsReads the evidence and flags every gap against the chosen methodology.
04 / 05
Document · Carbon Intel
Draft, report and audit-proof
Our flagship AI model for carbon project documentation. It reads your project evidence, flags every compliance gap against the chosen methodology, and drafts the Project Design Document, monitoring reports and audit responses, with a citation behind each claim.
- Starts from
- Project evidence and the methodology
- Hands on
- A drafted PDD or monitoring report, gaps flagged, and a citation under every claim
 MethodologiesFifty-plus methodologies across eleven registries, parsed.The document setEach methodology linked to the documents and evidence it demands.
05 / 05
Navigate · Carbon Compass
Find your way through the rules
The registry corpus, parsed. More than fifty methodologies across eleven registries, each linked to the documents, templates and evidence it requires. Use it at any stage to find out exactly what applies to your project.
- Starts from
- Project type and geography
- Hands on
- The applicable methodology and the full document set it requires
Building with recognised support.
 Bengal Business Accelerator · 2025
 Programme member
 DPIIT-recognised startup
Fifty-plus methodologies across eleven registries, parsed and linked to the evidence each one demands











Human judgement above the modules
Our AI model does the heavy lifting. Experts make sure it stands up to scrutiny.
Software automates the analysis. It cannot anticipate how a validator will challenge the project, so an expert reviews every module's output before it reaches certification.
- 01
Feasibility
Assessed by model, confirmed by an expert.
The model scores eligibility, species, cost and carbon potential. An expert checks the assumptions and confirms the pathway before capital is committed.
- 02
Documentation & validation screening
Drafted by AI, read as a validator would.
AI drafts the PDD, the calculations and the evidence review. An expert then screens it from the validator's side, so gaps surface early rather than in review.
- 03
Monitoring & issuance
Automated capture, expert quality assurance.
Field data, biomass and carbon calculations are processed automatically. Experts check them for accuracy and traceability before verification.
Prefeasibility check
Validate your idea.
Answer a few questions to see whether your land could carry a carbon project, then map the boundary in FloraScope.
Email only · No company data asked for
- 01Tell us about the landWho you are, the kind of project, the land's status, who holds it.
- 02Get an indicationLikely, possible, or worth a conversation — read from your answers.
- 03Take the next stepMap and screen the boundary in FloraScope, or talk it through with us.
Ecosystem partners
Our collaborators
Working with mission-aligned organisations to accelerate measurable climate impact.